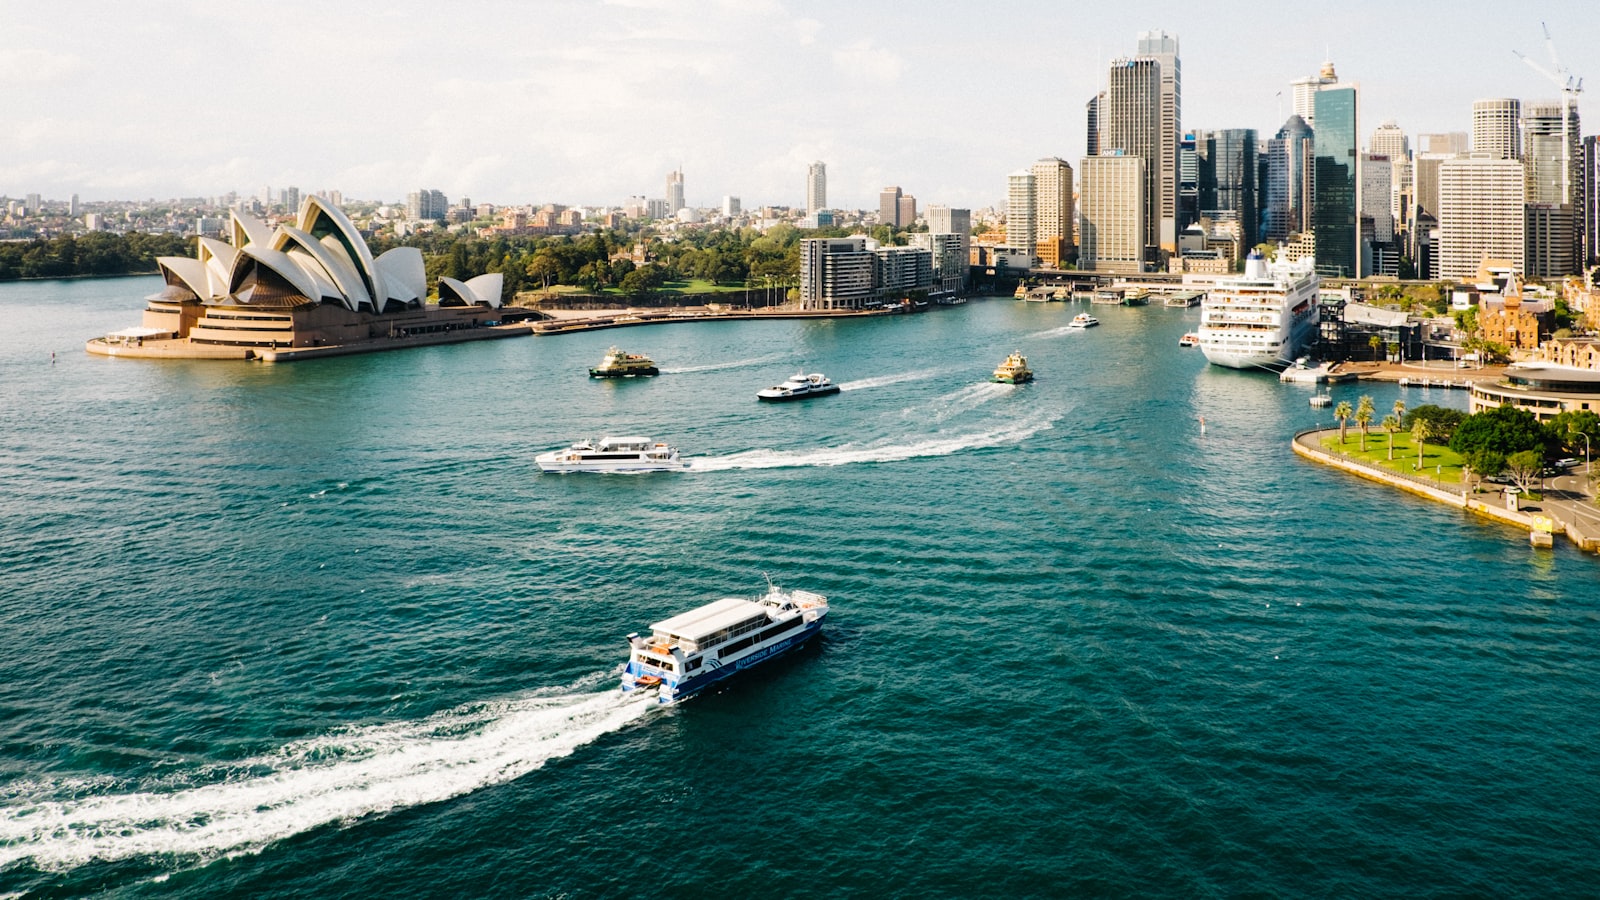
Franchise Opportunities in New South Wales
New South Wales is Australia's largest franchise market. With around 8.4 million people, it spans the dense, high-spend Sydney metro and a string of fast-growing regional cities, Newcastle, the Central Coast, Wollongong and the North Coast, giving buyers everything from premium café sites to low-cost mobile service territories.
Franchises for sale in New South Wales
263 franchise systems are recruiting or hold an open territory in New South Wales, franchises you can buy into now. A selection by network size:
| Franchise | Category | Units (AU) | Total investment |
|---|---|---|---|
| Jim's Mowing | Lawn & Garden | 2,600 | $20K–$50K |
| Subway Australia | Quick-Service Food | 1,245 | $300K–$1.1M |
| McDonald's Australia | Quick-Service Food | 1,076 | $1.5M–$2.6M |
| 7-Eleven Australia | Retail | 1,074 | $47K–$297K |
| Jim's Cleaning | Cleaning | 800 | $25K–$35K |
| Ray White | Real Estate | 714 | $150K–$350K |
| Domino's Pizza Australia | Quick-Service Food | 709 | $475K–$890K |
| Flight Centre | Travel & Cruise | 650 | $70K–$220K |
| Mortgage Choice | Mortgage & Finance | 639 | $71K–$132K |
| TerryWhite Chemmart | Health & Medical | 622 | $1M–$2M |
Franchise opportunity by location in New South Wales
Greater Sydney: the strongest franchise categories and best-scoring suburbs across the whole city →Cities & regional centres
Queanbeyan
86Parramatta
80Liverpool
79Penrith
78Maitland
78Newcastle
77Central Coast
76Cessnock
76Wagga Wagga
75Wollongong
75Dubbo
75Ballina
73Orange
73Shoalhaven
70Tamworth
70Bathurst
70Port Macquarie
69Tweed Shire
68Coffs Harbour
67Lismore
65Suburbs & localities
Every ABS SA2 suburb or locality in New South Wales with 8,000+ residents, ranked by opportunity score, 469 areas; the top 24 are shown in full.
Schofields - East
92North Kellyville
87Asquith - Mount Colah
86Mascot
85Erskineville - Alexandria
85Oran Park
85Quakers Hill
84Baulkham Hills - East
84Lindfield - Roseville
84Wentworthville - Westmead
84Ermington - Rydalmere
82Baulkham Hills (West) - Bella Vista
82Wentworth Point - Sydney Olympic Park
82Orange - North
81Dural - Kenthurst - Wisemans Ferry
81St Ives
81Warnervale - Wadalba
81Albion Park - Macquarie Pass
81Marsden Park - Shanes Park
81Kingswood - Werrington
80Sutherland - Kirrawee
80Concord - Mortlake - Cabarita
80Pennant Hills - Cheltenham
80Kellyville Ridge - The Ponds
80Population, income & growth: ABS Census 2021 and Estimated Resident Population. Opportunity score combines demand, competition, demographics, growth and franchise availability, see methodology.
New South Wales at a glance
| Metric | NSW | National | Difference |
|---|---|---|---|
| Population | 8,592,524 | 27,613,654 | 31.1% of AUS |
| Population growth (5-yr) | +5.9% | n/a | rank 7/8 |
| Median age | 39 | 38 | +1 |
| Median weekly household income | $1,829 | $1,746 | +4.8% |
| Total households | 2,900,468 | 9,275,217 | -68.7% |
| Renter households | 32.6% | 30.6% | +2.0pp |
| Unemployment rate | 4.1% | 4.3% | -0.2pp |
| Participation rate | 65.9% | 66.8% | -0.9pp |
| Actively trading businesses | 916,603 | n/a | n/a |
| Annual rainfall (Sydney) | 1,211mm | n/a | n/a |
Population & labour force: ABS. Demographics: ABS Census 2021.
Age distribution in New South Wales
A younger profile favours fitness, coffee and fast-casual food; an older one favours aged care, health and home services. Source: ABS Census 2021.
Housing & households in New South Wales
How people live shapes what they buy. Tenure, dwelling type and household make-up point to the categories most likely to work here.
| Indicator | NSW | What it signals |
|---|---|---|
| Renter households | 32.6% | Rental-heavy areas turn over faster and suit convenience, fitness and food. |
| Owned with a mortgage | 32.5% | Mortgage-belt families spend on services, childcare and casual dining. |
| Owned outright | 31.5% | Outright owners skew older, favouring health, aged care and home services. |
| Detached houses | 65.6% | Backyard suburbs lift lawn, pool, cleaning and home-trade demand. |
| Apartments & units | 21.7% | Higher density concentrates foot traffic for cafés and quick-service food. |
| Family households | 71.2% | Families anchor education, childcare, tutoring and family dining. |
| Single-person households | 25.0% | Singles favour convenience, meal-based food and fitness. |
Source: ABS Census 2021 (QuickStats) · 2021
New South Wales franchise opportunity map
Every marker is a real trade-area market, placed by its ABS centroid and coloured by opportunity score. Marker size reflects population; click a market for its full report.
Recommended franchise categories for New South Wales
| # | Category | Demand | Competition gap | Demographic fit | Growth | Overall |
|---|---|---|---|---|---|---|
| 1 | Quick-Service Food | 55 | 67 | 54 | 45 | 61 |
| 2 | Coffee & Café | 55 | 67 | 54 | 45 | 55 |
| 3 | Bakery & Dessert | 55 | 61 | 54 | 45 | 54 |
| 4 | Retail | 55 | 59 | 54 | 45 | 54 |
| 5 | Hair & Barber | 55 | 66 | 54 | 45 | 54 |
| 6 | Food & Beverage | 55 | 67 | 54 | 45 | 53 |
| 7 | Beauty & Health | 55 | 59 | 54 | 45 | 52 |
| 8 | Cleaning | 55 | 53 | 54 | 45 | 52 |
 61/100
Quick-Service Food
Best NSW markets: Schofields - East (92), North Kellyville (87), Queanbeyan (86).
Explore quick-service food 55/100
Coffee & Café
Best NSW markets: Schofields - East (81), Asquith - Mount Colah (81), Queanbeyan (80).
Explore coffee & café 54/100
Bakery & Dessert
Best NSW markets: Schofields - East (86), Marsden Park - Shanes Park (81), Asquith - Mount Colah (78).
Explore bakery & dessertScores weight ABS population, income and growth, Census demographic fit, local competition (OpenStreetMap operator counts where available, else a trade-area model) and live franchise availability. Indicative only, not a guarantee of success.
Business landscape in New South Wales
Source: ABS Counts of Australian Businesses · 2025
Business churn: 16.5% of businesses were new entries, 14.1% exited, for net growth of +2.2% over the year. A steadily growing business base is a sign of a healthy local economy for a new franchise.
Franchise cost benchmarks
| Category | Median initial fee | Royalty | Marketing levy | Total investment |
|---|---|---|---|---|
| Cleaning | $12,000 | Not enough data | Not enough data | $27,000–$80,000 |
| Coffee & Café | $35,000 | 6.0% | 3.0% | $300,000–$700,000 |
| Food & Beverage | Not enough data | Not enough data | Not enough data | $650,000–$1,475,000 |
| Fitness & Wellbeing | $49,000 | Not enough data | Not enough data | $250,000–$500,000 |
| Aged & Disability Support | $75,000 | Not enough data | Not enough data | $89,000–$163,000 |
| Home & Trade Services | Not enough data | Not enough data | Not enough data | $51,000–$128,000 |
| Automotive | $40,000 | 6.5% | 3.0% | $156,000–$500,000 |
| Education & Tutoring | Not enough data | Not enough data | Not enough data | $48,000–$100,000 |
National medians from the Australian Franchise Fee Index, built from the fees franchisors publish and their ACCC Register establishment costs. “Not enough data” means fewer than five systems publish that figure.
Climate & seasonality
| Climate zone (Sydney) | Temperate |
| Avg summer maximum | 26°C |
| Avg winter minimum | 8.1°C |
| Annual rainfall | 1,211mm (Uniform) |
| Sunshine | 6.8 hrs/day |
| Frost risk | Low |
Mild, uniformly wet temperate climate supports year-round outdoor dining, cafe and home-services franchises without extreme seasonal demand swings.
Source: Bureau of Meteorology climate averages · BOM climate averages
Tourism & visitor demand
| Annual domestic visitors | 37,484,500 |
| Annual international visitors | 3,805,700 |
| Total visitor nights | 215,332,700 |
| Total visitor spending | $43.5B |
| Peak season | Summer (Dec–Feb) |
| Top tourism regions | Sydney, North Coast NSW, South Coast |
Strong visitor volumes lift demand for food & beverage, coffee, retail and hospitality franchises, plan for peak/off-peak staffing.
Source: Tourism Research Australia · 2024
Transport & infrastructure
| Airport | Location | Annual passengers | Type |
|---|---|---|---|
| Sydney Airport (Kingsford Smith) | Mascot, Sydney | 41,845,862 | International |
| Newcastle Airport (Williamtown) | Williamtown | n/a | Domestic |
| Coffs Harbour Airport | Coffs Harbour | n/a | Regional |
- Pacific Highway / Pacific Motorway (M1), Sydney–Newcastle–Coffs Harbour–Queensland border
- Hume Highway (M31), Sydney–Goulburn–Albury (Victoria border)
- Princes Highway (A1), Sydney–Wollongong–Nowra–Victoria border
- Port Botany (Container)
- Port of Newcastle (Bulk)
Sydney Trains operates the metropolitan suburban network while NSW TrainLink runs intercity and regional services, with interstate freight carried on the ARTC-managed network.
Highway corridors suit drive-through food, fuel and automotive franchises; airport and transport hubs suit food and retail formats.
Source: BITRE aviation statistics & public infrastructure data · 2024-25
Commercial property & retail
Major shopping centres, prime anchor sites for retail, food and service franchises in New South Wales:
| Centre | Location |
|---|---|
| Westfield Parramatta | Parramatta |
| Macquarie Centre | North Ryde |
| Westfield Bondi Junction | Bondi Junction |
| Westfield Sydney | Sydney CBD |
Sydney metro carries the highest fit-out and rent costs in the country, so bricks-and-mortar franchises here sit at the upper end. Regional NSW and home-based/mobile models offer far lower entry points, often under $100,000. Retail rents vary by centre and strip, confirm current rates with the landlord or a commercial agent.
Expanding your franchise into New South Wales?
| Total population | 8,592,524 |
| Population growth | 1.2% p.a. (rank 7/8) |
| Median household income | $1,829/wk |
| Systems already recruiting | 263 |
| Trade-area markets scored | 489 |
Lower-scoring categories with strong demographics signal white space. See the category table above for where NSW demand outruns supply.
Franchises in New South Wales, FAQs
What are the best franchise opportunities in New South Wales?
Based on ABS population, demographics and competition analysis, the strongest franchise categories in New South Wales are Quick-Service Food, Coffee & Café, Bakery & Dessert. With a population of 8,592,524 growing 1.2% a year, New South Wales supports steady demand across food, fitness and home-service formats.
How much does a franchise cost in New South Wales?
Median all-in costs run from about $18K for home-based and mobile models to $1.5M for full bricks-and-mortar formats. New South Wales's median weekly household income is $1,829 (+4.8% vs the national $1,746). See the Fee Index for category-by-category costs.
What franchise categories work best in regional New South Wales?
Regional NSW centres such as Newcastle, Wollongong, Parramatta typically have lower competition than Sydney and reward home services, food and fitness franchises. Entry costs are usually lower outside the capital.
Are there franchises for sale in New South Wales?
Yes, 263 franchise systems on FranchiseScope list an open territory in New South Wales. Availability changes, so confirm with each franchisor, or register your interest to hear about new openings.
What is the population of New South Wales?
As of 2025, New South Wales has an estimated resident population of 8,592,524, about 31.1% of Australia's total. It grew 1.2% per year over the last five years, the 7th fastest-growing state or territory. Source: ABS National, state and territory population.
What is the climate like in New South Wales?
Sydney has a temperate climate, average summer maximums around 26°C and winter minimums near 8.1°C, with about 1,211mm of rain a year. Mild, uniformly wet temperate climate supports year-round outdoor dining, cafe and home-services franchises without extreme seasonal demand swings. Source: Bureau of Meteorology.
What are the fastest growing areas in New South Wales?
The fastest-growing markets in New South Wales include Marsden Park - Shanes Park (+1368.4% over 5 years), Box Hill - Nelson (+593.2% over 5 years), Edmondson Park (+414.9% over 5 years). These growth corridors offer the strongest new-outlet franchise opportunities. Source: ABS Estimated Resident Population.
How do I compare franchise opportunities in New South Wales?
Use FranchiseScope's verified Fee Index, location opportunity scores and live territory availability to compare franchises side by side, filter by category, investment range and location across New South Wales.
Explore more
Methodology & sources
Opportunity scores use a weighted model: 30% demand (population, households, income), 25% competition gap (business density vs population), 20% demographic fit, 15% growth, 10% franchise availability. Data comes from ABS National, state and territory population; ABS Census 2021; ABS Labour Force; ABS Counts of Australian Businesses; Bureau of Meteorology; Tourism Research Australia; BITRE; OpenStreetMap; and FranchiseScope's Fee Index of published franchise costs. Scores are indicative only and do not guarantee franchise success.
This page is general information only, not legal, financial or business advice. Franchise costs, territories and availability change frequently. Review the franchisor's disclosure document and seek independent legal and accounting advice before entering any franchise agreement.
Ready to build your New South Wales business?
Build a free profile and let franchisors growing in New South Wales come to you. Your details stay private until you're ready to talk, no pressure, no cold calls.